top of page

Result (Winter Case)
Temperature Graph
-
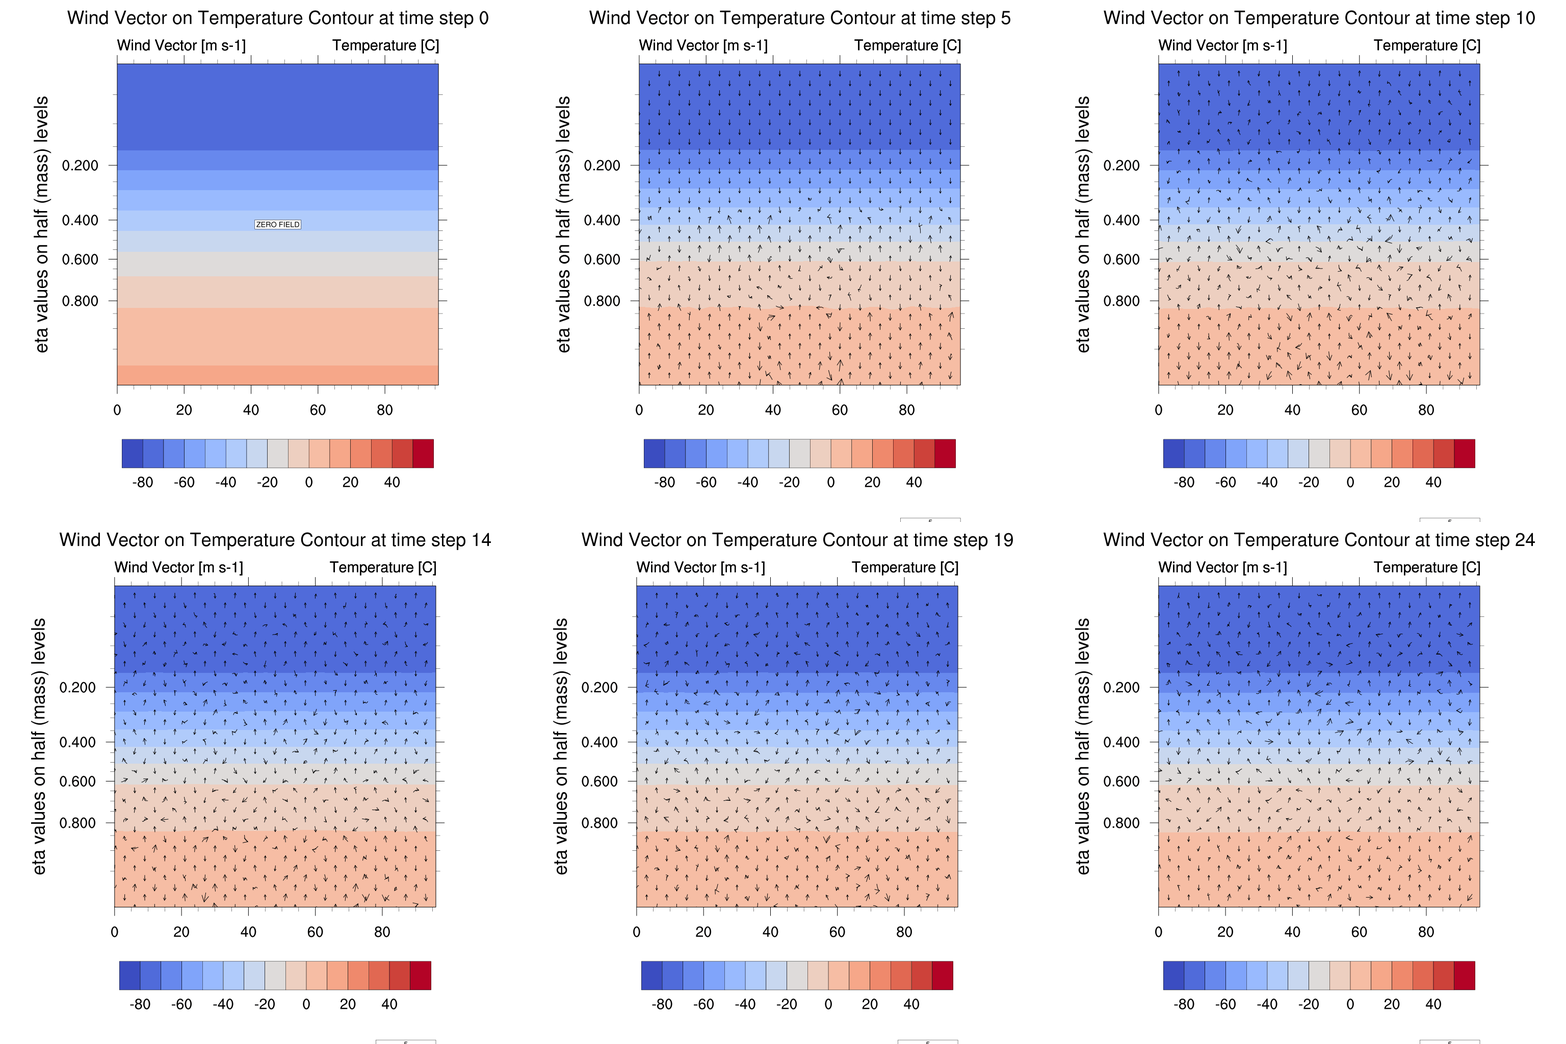
Temperature contour with wind vector arrow
lm = 10 (Urban 20%, 40km)
lm = 20 (Urban 40%, 80km)
lm = 40 (Urban 80%, 160km)


-
Surface temperature
lm = 10 (Urban 20%, 40km)
lm = 20 (Urban 40%, 80km)
lm = 40 (Urban 80%, 160km)


-
Max Difference in Surface Temperature

Wind Graph
-
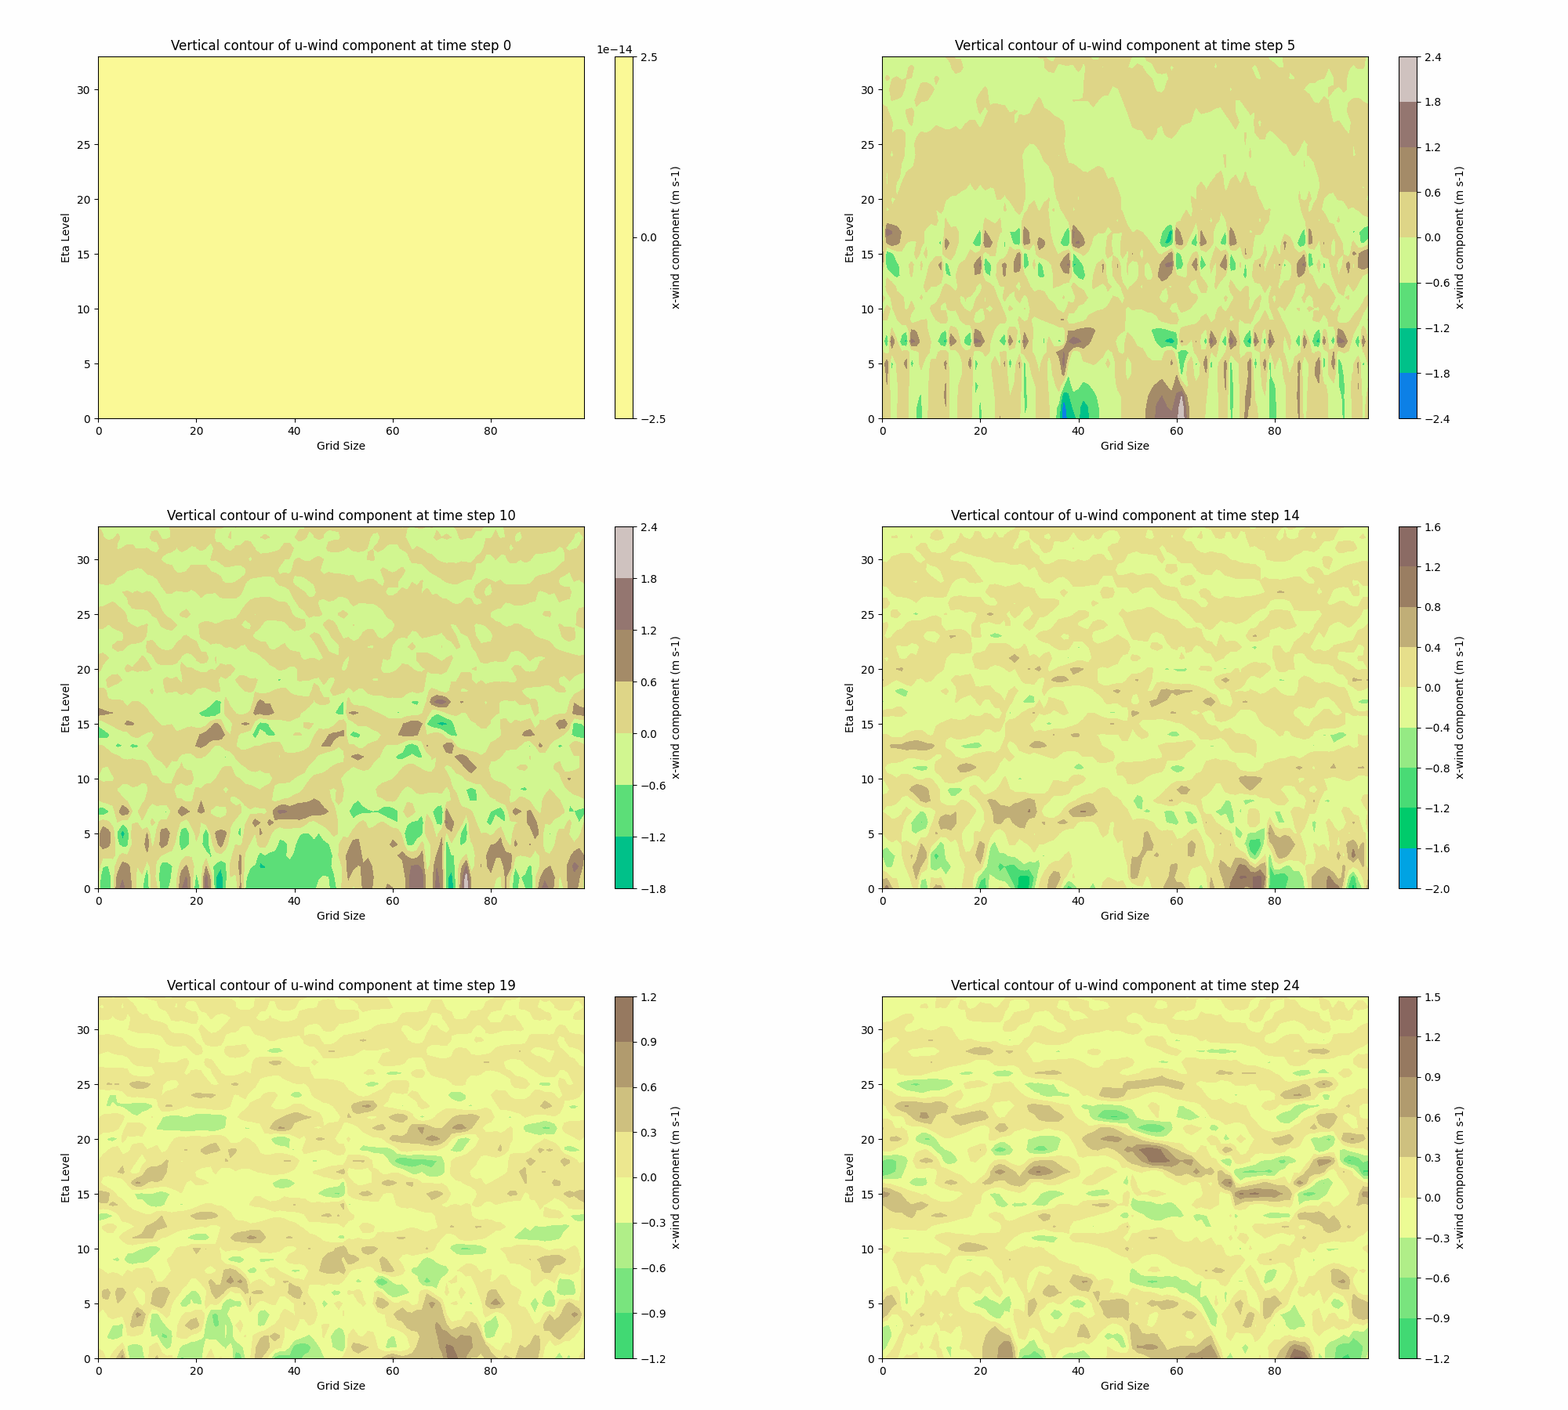
U wind contour (X-direction wind)
lm = 10 (Urban 20%, 40km)
lm = 20 (Urban 40%, 80km)
lm = 40 (Urban 80%, 160km)


-
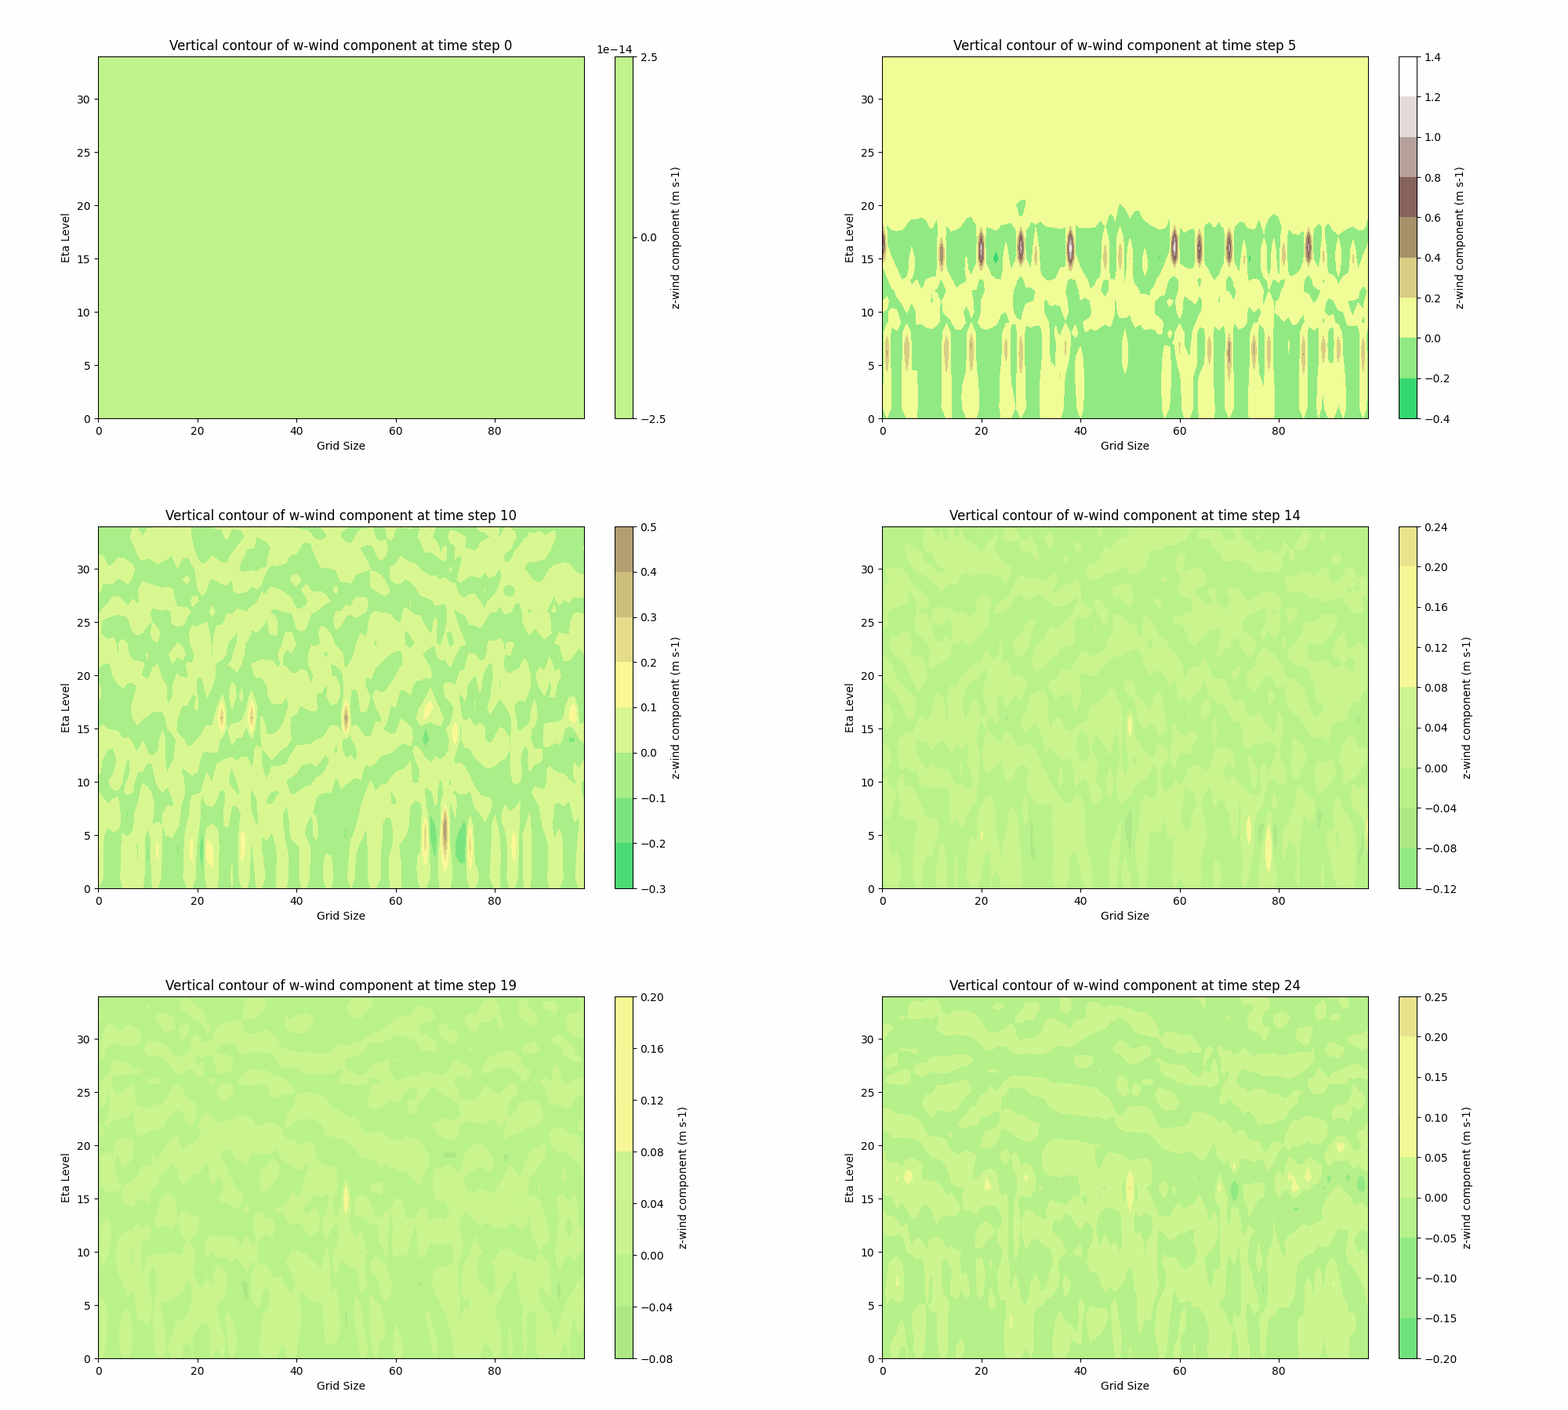
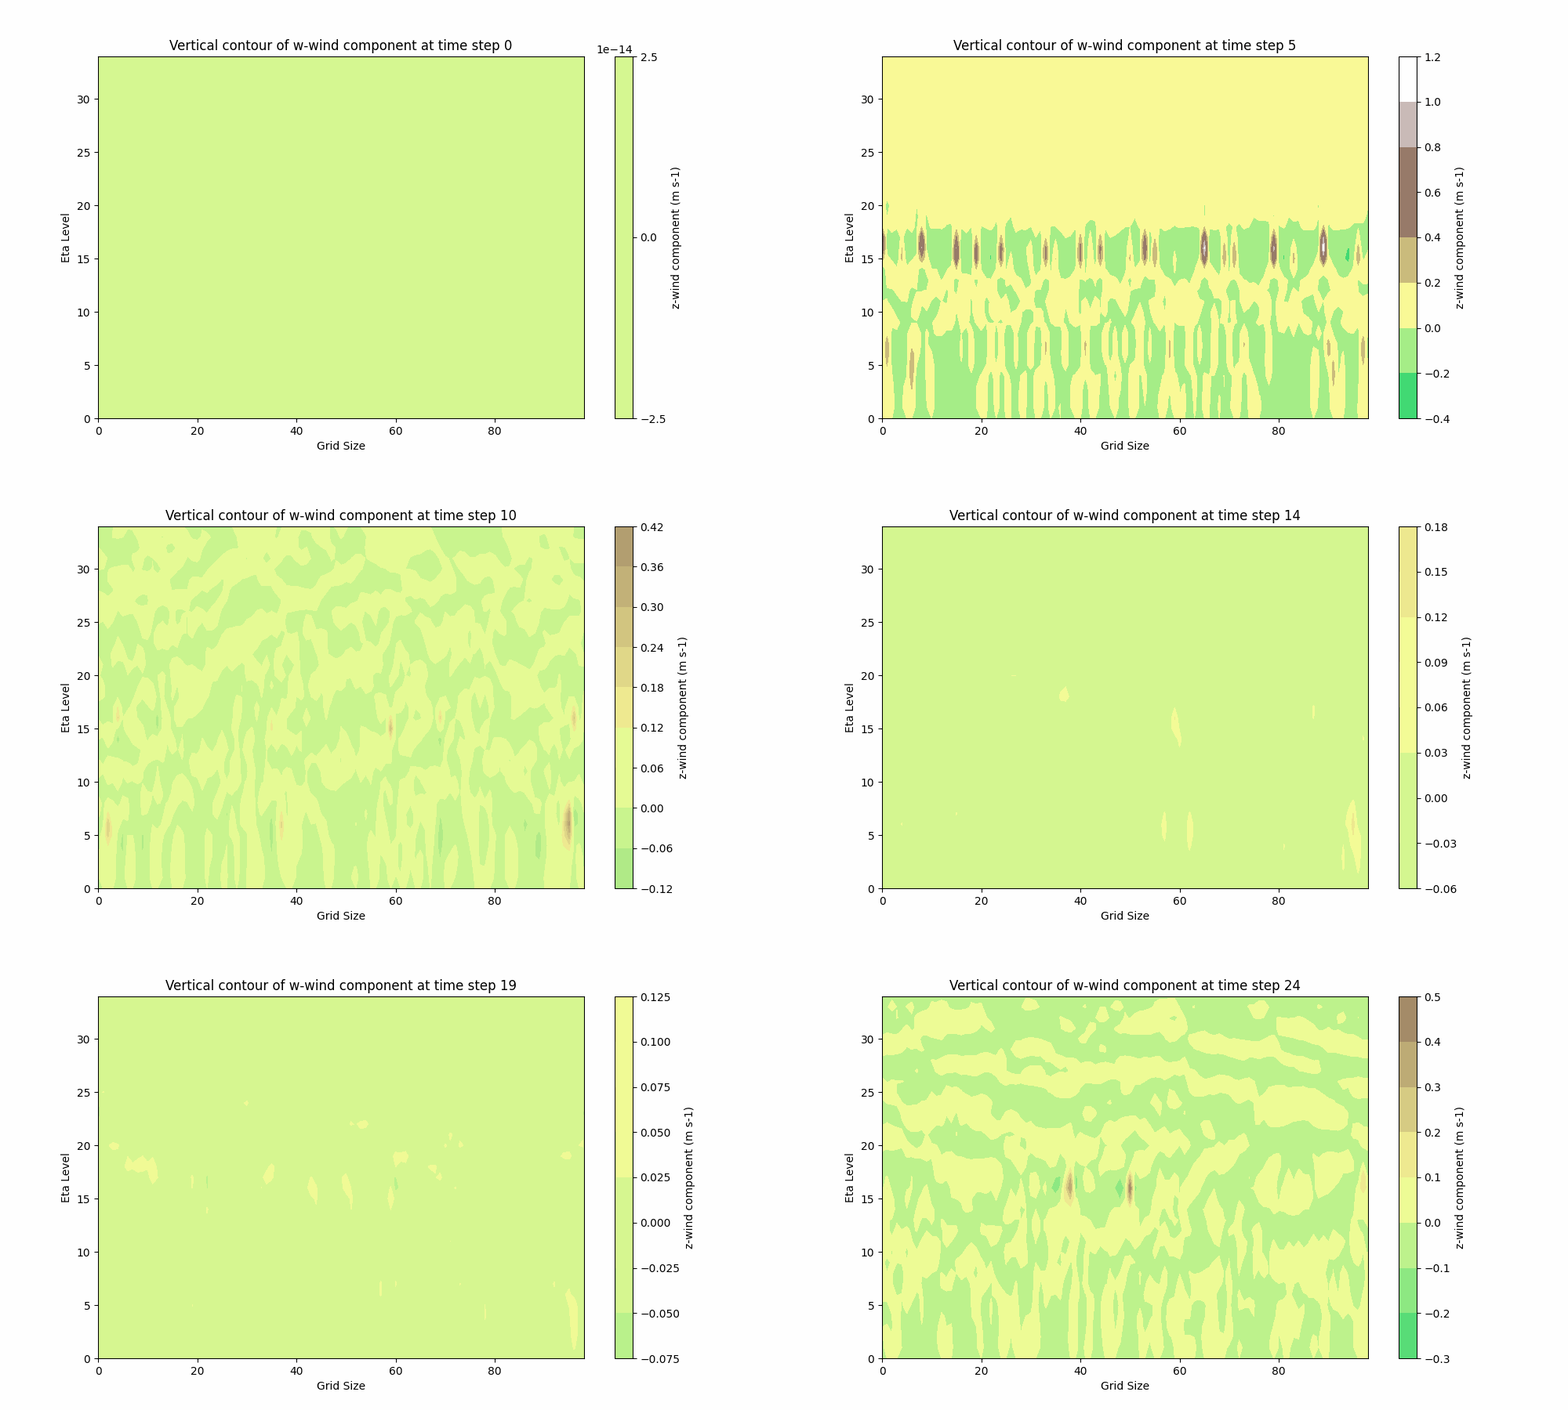
W wind contour (Vertical wind)
lm = 10 (Urban 20%, 40km)
lm = 20 (Urban 40%, 80km)
lm = 40 (Urban 80%, 160km)


2023-2 Numerical Weather Prediction
Team 4
Ideal Urban Heat Island Simulation
- Analysis of relationship between heat dome intensity and the degree of urbanization
bottom of page

