top of page

Default Case
Surface Temperature Analysis

lm = 10 (Urban 20%, 40km)
-
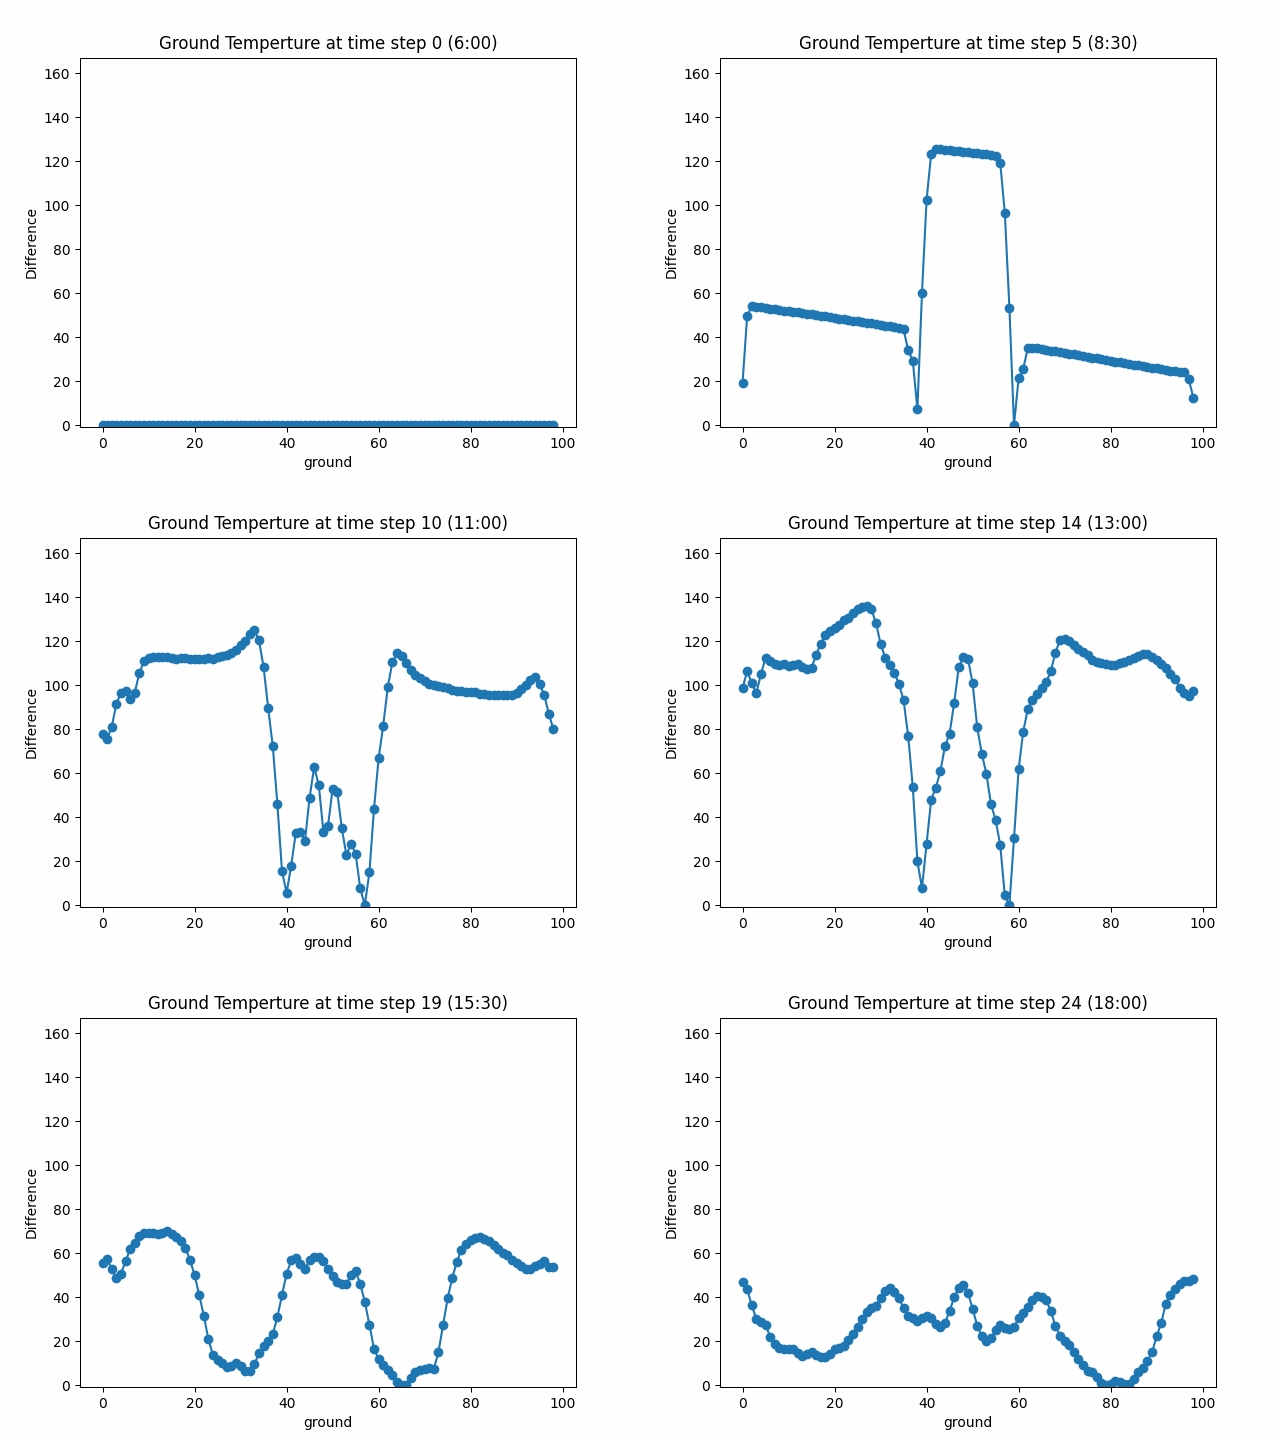
Surface Temperature
- Difference Max: 1.65 K
- Diff Max occur time:
6:30 PM
lm = 20 (Urban 40%, 80km)
-
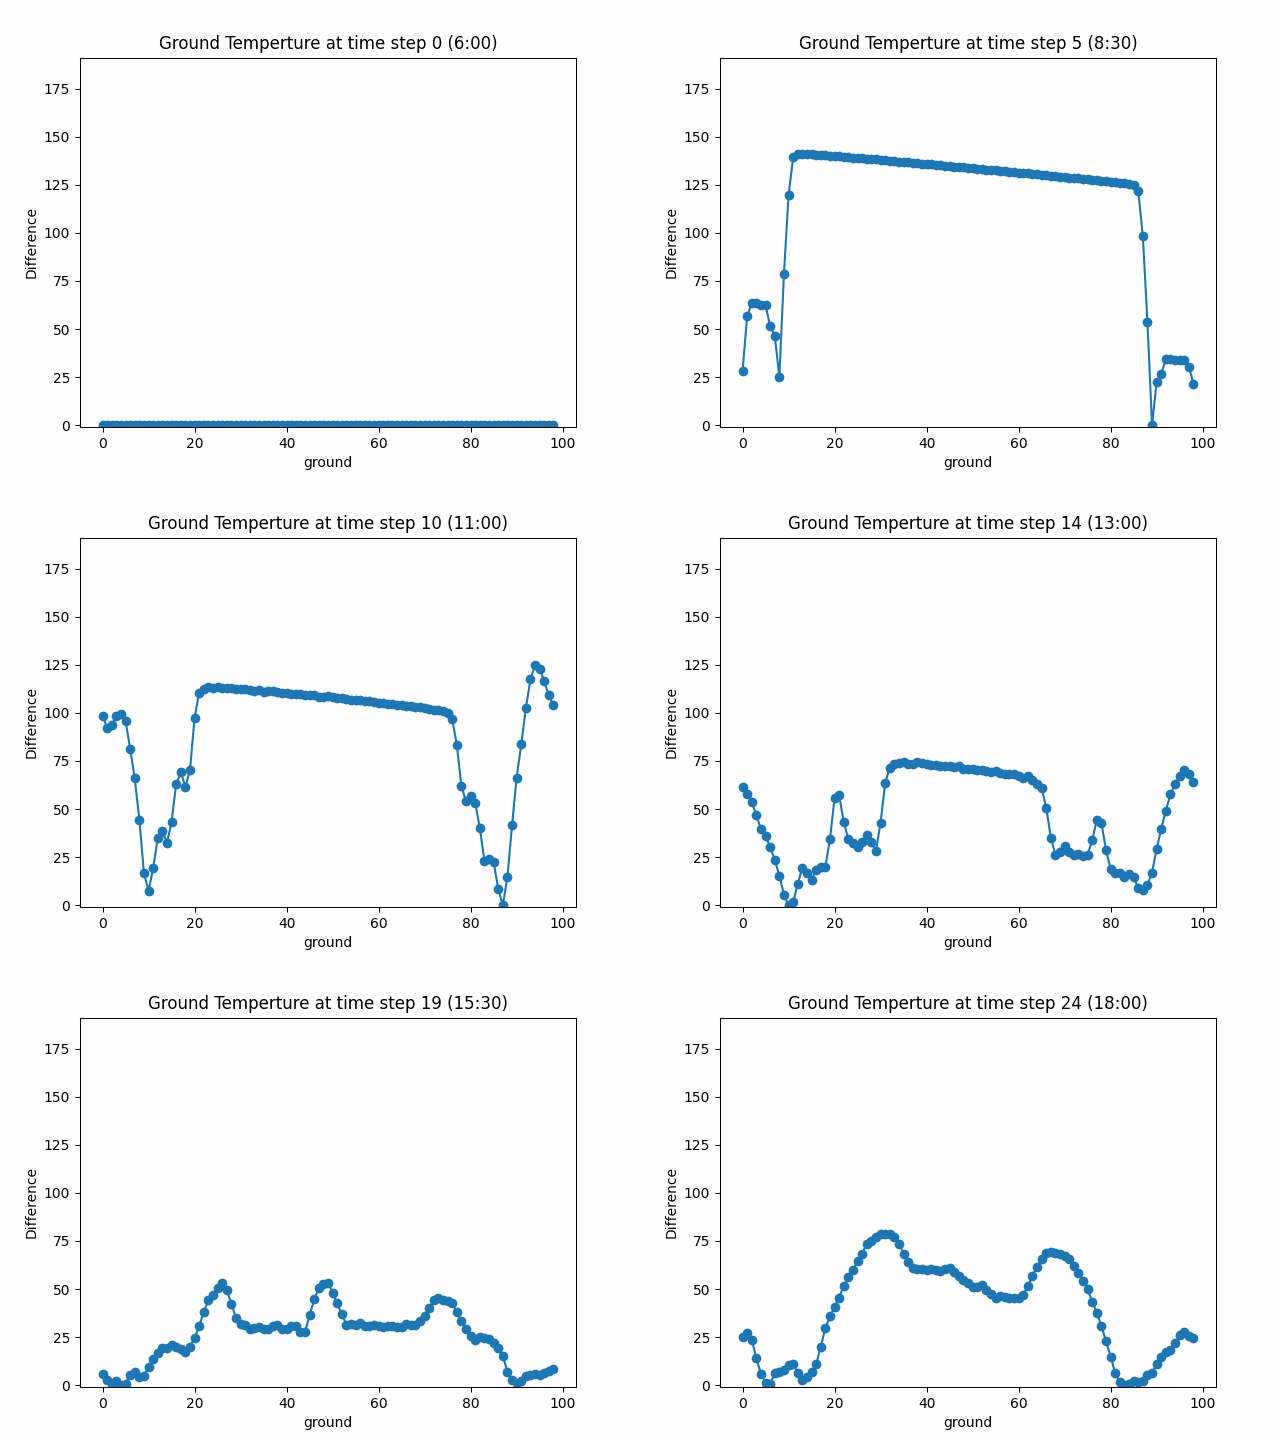
Surface Temperature
- Difference Max: 1.73 K
- Diff Max occur time:
6:30 PM
lm = 40 (Urban 80%, 160km)
-
Surface Temperature
- Difference Max: 1.89 K
- Diff Max occur time:
6:00 PM


[Surface T deviation_(local time minimum)]
- As land size increases, the maximum temperature deviation increases.
- The time period during which the maximum deviation appeared was similar with respect to urban size
U-wind Analysis
-
U Wind
- Collision time:
9:00PM
- Average Velocity change:
0.232 m/s (Before Collision)
> 0.160 m/s (After Collision)

-
U Wind
- Collision time:
11:00PM
- Average Velocity change:
0.259 m/s (Before Collision)
> 0.208 m/s (After Collision)

-
U Wind
- Collision time:
00:30AM
- Average Velocity change:
0.141 m/s (Before Collision)
> 0.171 m/s (After Collision)

[U wind]
- As land size increases, the transition time point from convergence to divergence in the center is delayed.
- The average speed of convergence (before collision) and divergence (after collision) calculated on one side of urban
decreases. ( The velocity was calculated with absolute values before and after the time point )
W-wind Analysis
lm = 10 (Urban 20%, 40km)
lm = 20 (Urban 40%, 80km)
lm = 40 (Urban 80%, 160km)


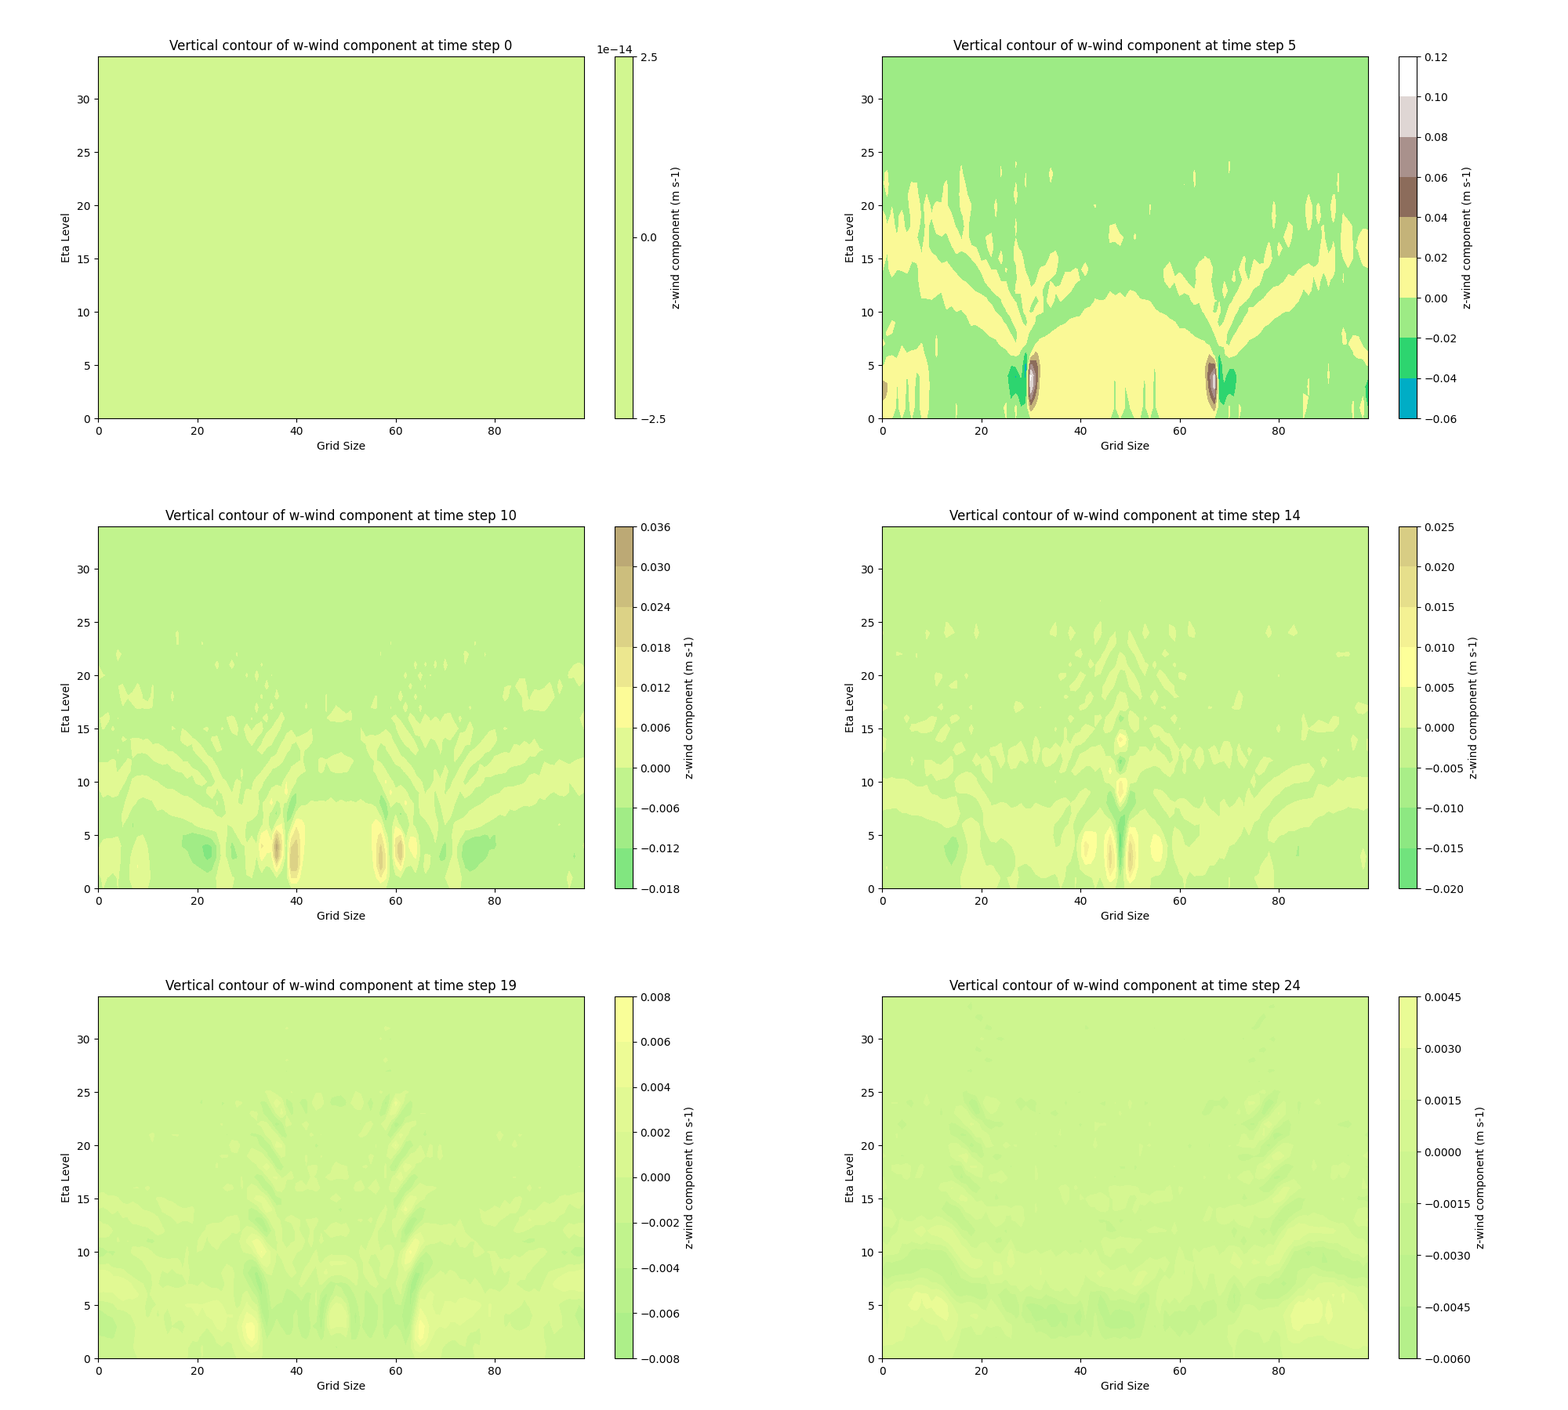
Timestep 4


[W wind]
- As land size increases, the dome-shaped upward wind field seen in the 5 PM widens.
- When the urban size is 40km, there is no downward wind inside the urban area at 5 PM.
- Strong upward and downward winds appear at the edge of the urban area
- As the U wind pushes the W wind, the W wind pattern converges toward the center and gets weak.
Summer Case
Surface Temperature Analysis

lm = 10 (Urban 20%, 40km)
-
Surface Temperature
- Difference Max: 2.66 K
- Diff Max occur time:
6:00 PM
lm = 20 (Urban 40%, 80km)
-
Surface Temperature
- Difference Max: 2.78 K
- Diff Max occur time:
6:00 PM
lm = 40 (Urban 80%, 160km)
-
Surface Temperature
- Difference Max: 3.04 K
- Diff Max occur time:
6:00 PM


[Surface T deviation_(local time minimum)]
- As land size increases, the maximum temperature deviation increases.
- The time period during which the maximum deviation appeared was similar with respect to urban size
U-wind Analysis
-
U Wind
- Collision time:
6:30PM
- Average Velocity change:
0.052 m/s (Before Collision)
> 0.114 m/s (After Collision)

-
U Wind
- Collision time:
7:00PM
- Average Velocity change:
0.029 m/s (Before Collision)
> 0.120 m/s (After Collision)

-
U Wind
- Collision time:
7:00PM
- Average Velocity change:
0.017 m/s (Before Collision)
> 0.076 m/s (After Collision)

[U wind]
- As land size increases, the transition time point from convergence to divergence in the center is delayed.
- The average speed of convergence (before collision) and divergence (after collision) calculated on one side of urban
decreases. ( The velocity was calculated with absolute values before and after the time point )
W-wind Analysis
lm = 10 (Urban 20%, 40km)
lm = 20 (Urban 40%, 80km)
lm = 40 (Urban 80%, 160km)


Timestep 7


[W wind]
- As land size increases, the dome-shaped wind field (contains both downward and upward) widens.
- Unlike the Default case, downward and upward wind co-exist in the dome area
- Strong upward and downward winds appear at the edge of the urban area
- As the U wind pushes the W wind, the W wind pattern converges toward the center and gets weak.
Timestep 9
Timestep 9
Winter Case
Surface Temperature Analysis

lm = 10 (Urban 20%, 40km)
-
Surface Temperature
- Difference Max: 1.76 K
- Diff Max occur time:
10:30 PM
lm = 20 (Urban 40%, 80km)
-
Surface Temperature
- Difference Max: 1.82 K
- Diff Max occur time:
8:30 PM, 10:00 PM
lm = 40 (Urban 80%, 160km)
-
Surface Temperature
- Difference Max: 1.45 K
- Diff Max occur time:
3:00 PM


[Surface T deviation_(local time minimum)]
- Maximum temperature deviation appears largest in the case of land size 80km ( lm=20) , followed by size
40km(lm=10), 160km(lm=40) .
- Maximum-value-appearing time points are also different. Therefore, it is hard to find a pattern.
U-wind Analysis
-
U Wind
- Collision time:
8:00PM
- Average Velocity change:
0.504 m/s (Before Collision)
> 0.292 m/s (After Collision)

-
U Wind
- Collision time:
8:30PM
- Average Velocity change:
0.427 m/s (Before Collision)
> 0.080 m/s (After Collision)

-
U Wind
- No Significant Pattern

[U wind]
- As the city size increased from 40km(lm=10) to 80km(lm=20), the conversion time point was delayed.
- On the other hand, in 160km(lm=40), the eastward wind was dominant throughout the time step.

2023-2 Numerical Weather Prediction
Team 4
Ideal Urban Heat Island Simulation
- Analysis of relationship between heat dome intensity and the degree of urbanization
bottom of page


